Why Is Nifty Falling? The Dollar Index and Crude Oil and US 10 Year Bond Yield, Explained
Nifty 50 closed at 22,421.95 on Thursday, 1 October, down 198.50 points (-0.88%) — the last trading session before Friday's market holiday — extending a slide that's accelerated sharply over the past few weeks. Three macro numbers are moving in the same direction as this decline: the US Dollar Index, now near 102, Brent crude, up to $106 a barrel after a single-day jump of over 4%, and the US 10-year Treasury yield, which has pushed above 5.2%. No single one of these explains everything happening in Indian equities — markets rarely move for just one reason — but all three are worth understanding, since they show up in almost every explanation of why risk assets have been under pressure.
What the Dollar Index actually measures
The US Dollar Index, usually shown as DXY, measures the dollar's strength against a basket of six major currencies — the euro carries the largest weight, followed by the Japanese yen, British pound, Canadian dollar, Swedish krona, and Swiss franc. The rupee isn't in that basket at all. But a rising DXY still matters for India: it's a broad signal that the dollar is strengthening against currencies generally, and the rupee tends to come under pressure in that environment too, even though it isn't measured directly.
The pattern on the chart
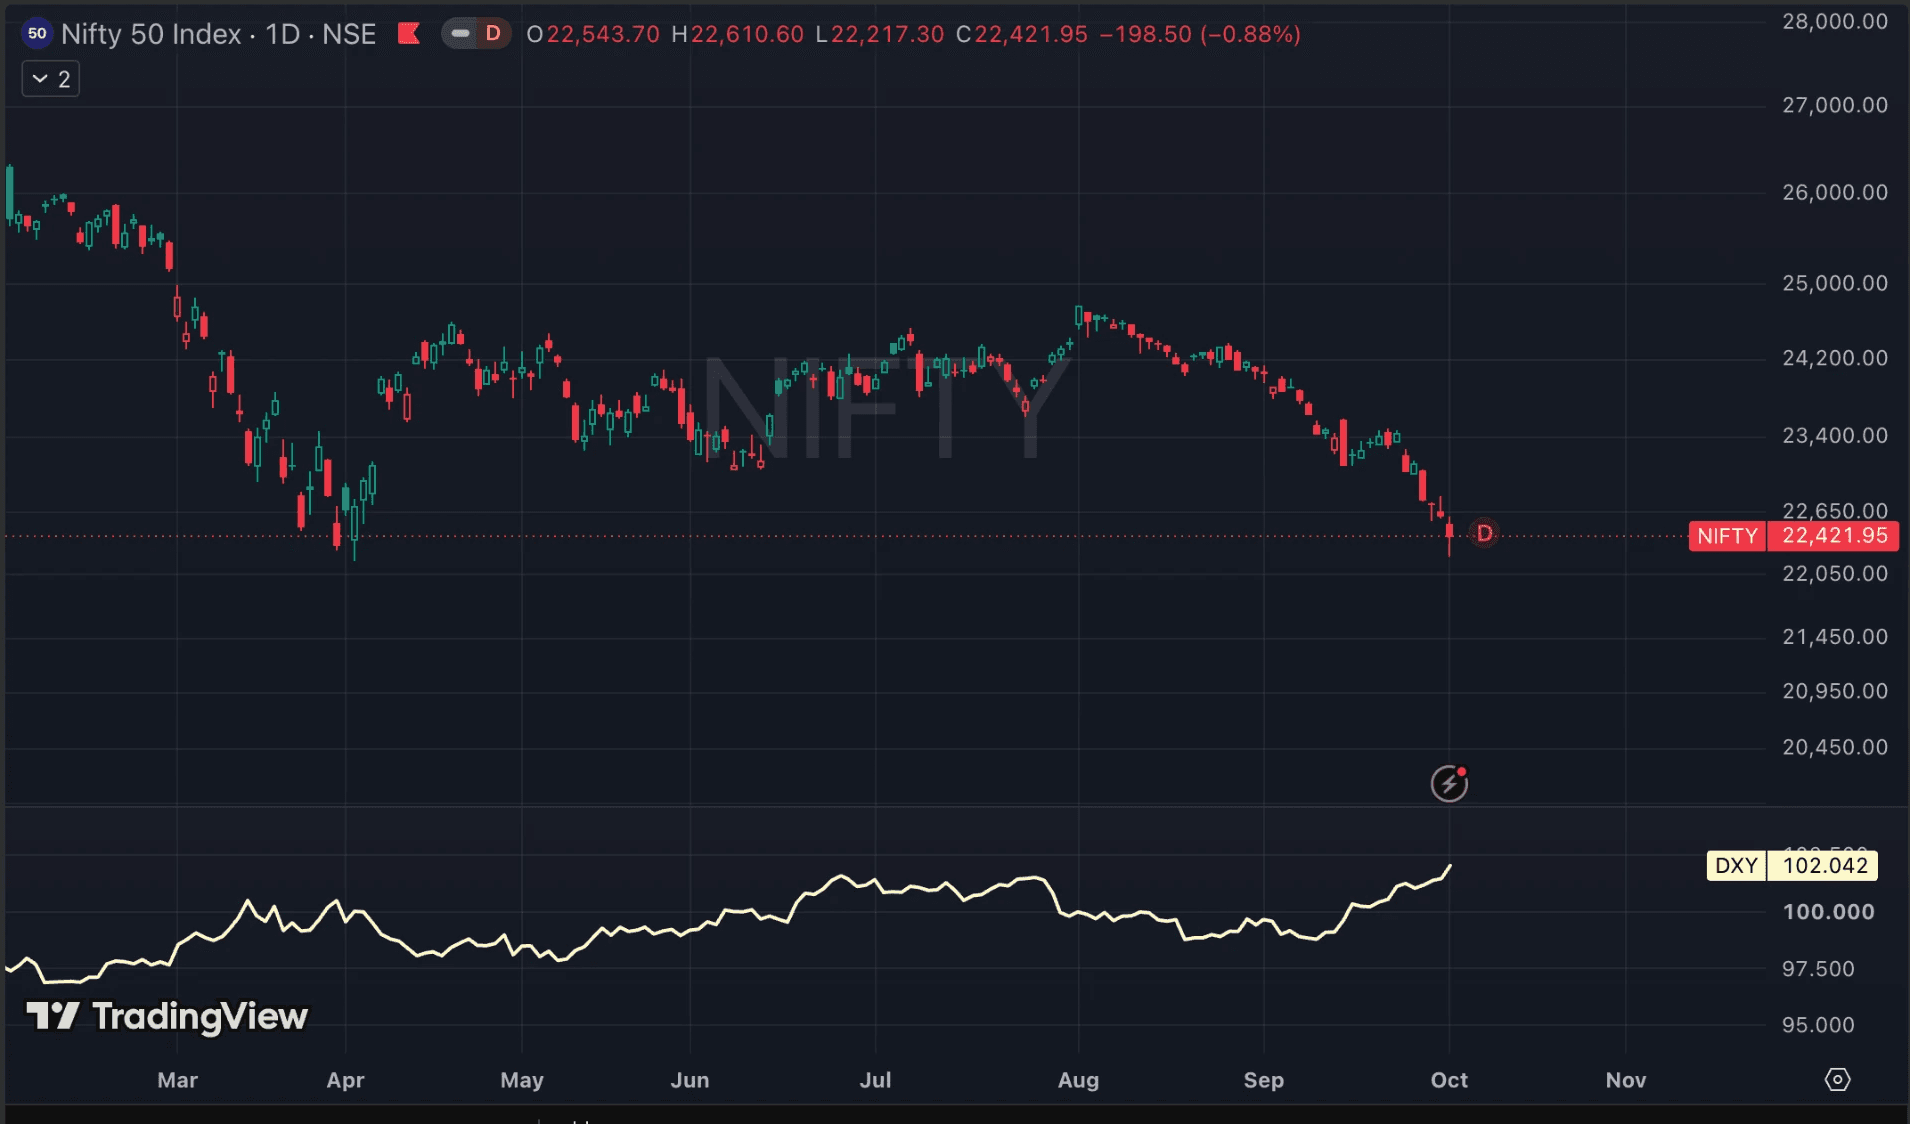
Layered against Nifty's daily chart, DXY's climb from the mid-90s earlier this year to above 102 now tracks closely with the index's retreat from its highs. The most recent leg is the sharpest part of both moves — DXY's push toward 102 and Nifty's drop toward 22,400 have happened within roughly the same few weeks.
Nifty 50 (candles) vs. US Dollar Index (DXY, bottom panel). Chart: TradingView.
A chart overlay isn't proof of causation
A chart showing two lines moving in opposite directions isn't proof that one caused the other — plenty else was happening in the same window. But the relationship between dollar strength and emerging-market equity weakness is well established enough to be worth understanding on its own terms, not just as a chart overlay.
Why a stronger dollar pressures Indian equities
Foreign institutional investors hold a meaningful share of free-float in Indian equities, and dollar-denominated investors care about dollar-denominated returns. When the dollar strengthens, the cost of hedging rupee exposure rises, and the return math for holding Indian equities gets a little less attractive at the margin — which tends to show up as FII selling, adding supply to the market exactly when sentiment is already soft.
A strong dollar also tends to weigh on the rupee directly. We've written before about the RBI's dollar swap window and the tools it uses to manage currency pressure — this is the same underlying dynamic showing up again.
Crude oil adds a second, separate pressure
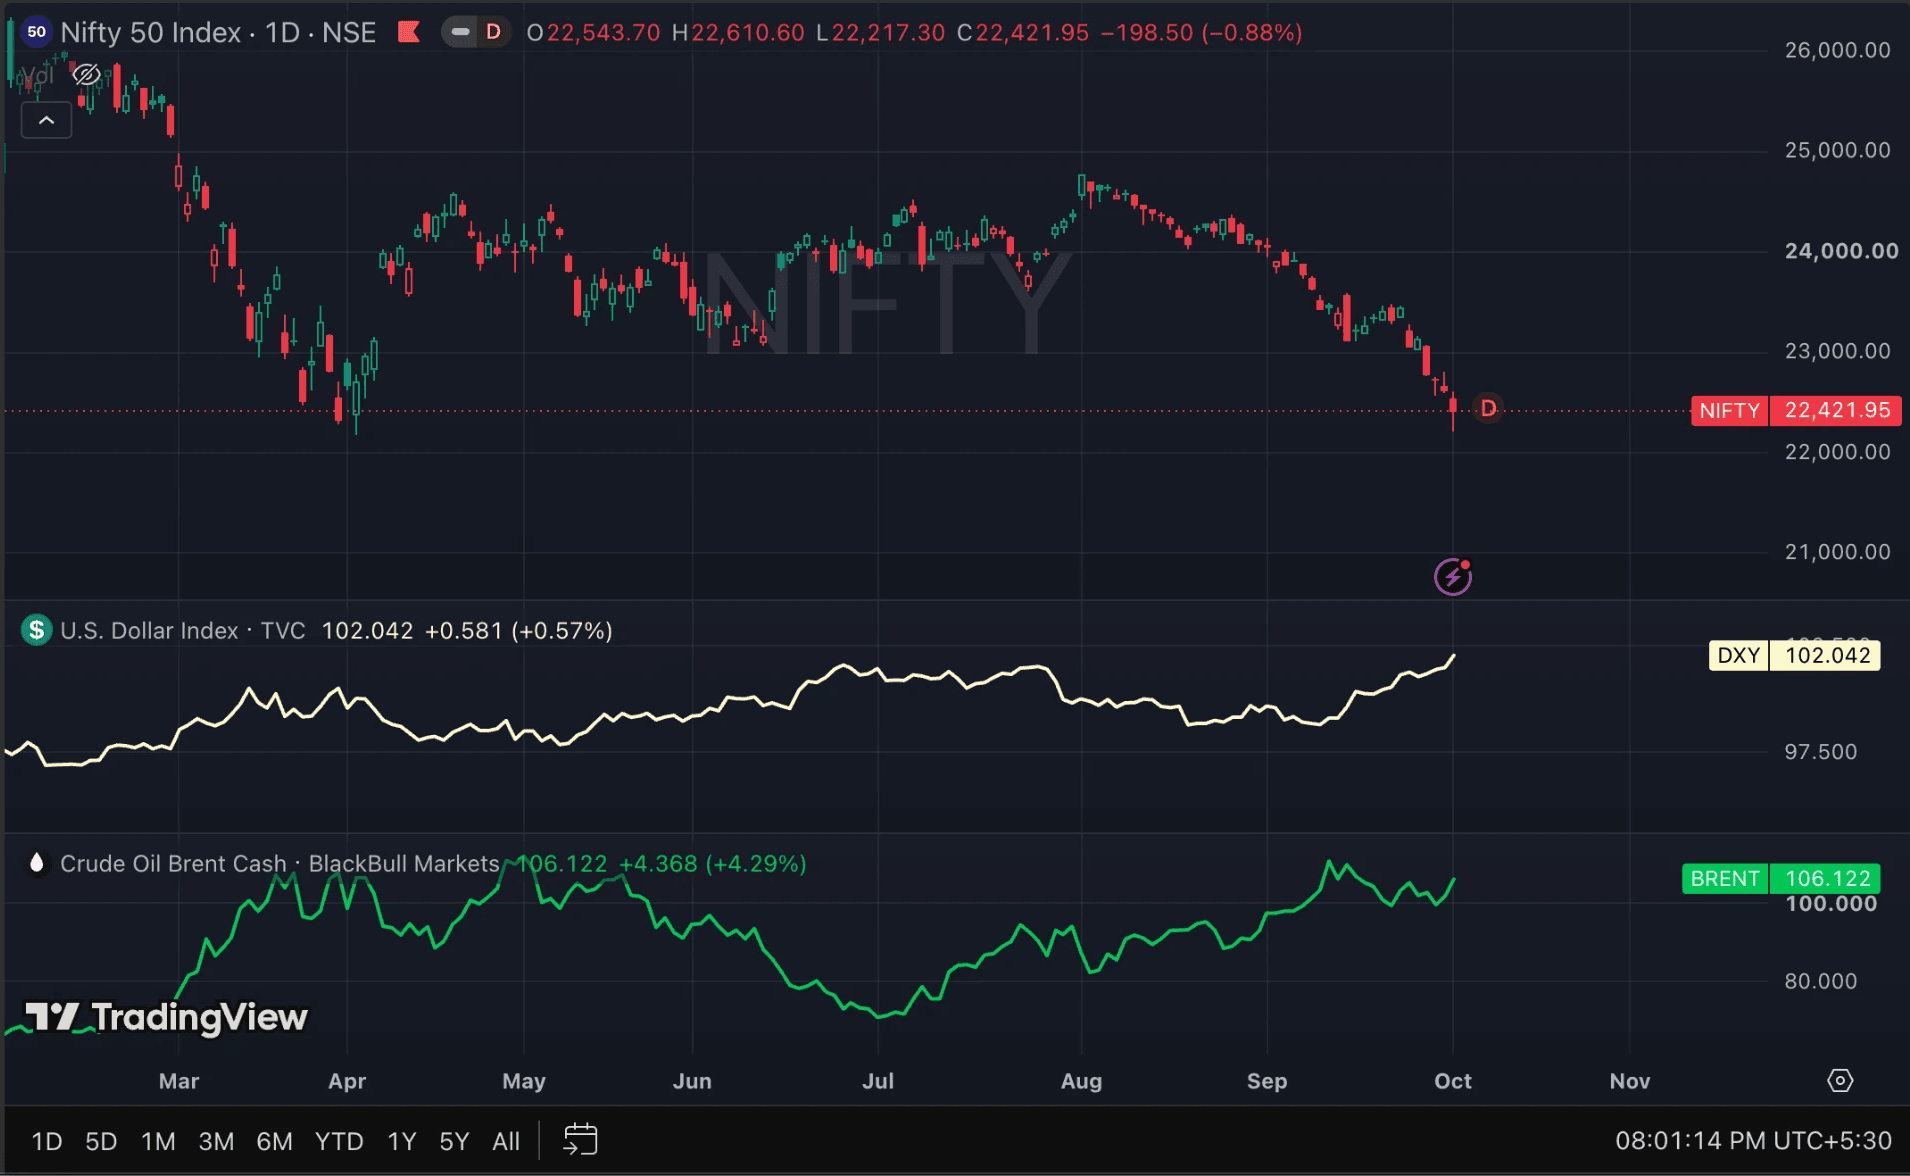
Brent crude closed at $106.122 a barrel, up 4.29% in a single session — a sharp move by any standard. India imports close to 85% of the crude oil it uses, so a jump like this isn't an abstract global number; it shows up directly in the trade deficit, in inflation expectations, and in the input costs of anything that runs on fuel, from logistics to aviation to chemicals.
Nifty 50, US Dollar Index (DXY), and Brent crude, together. Chart: TradingView.
Three moves, roughly together
On the same chart as Nifty and DXY, Brent's recent spike happened in almost the same window as the dollar's push higher and the index's steepest leg down — three moves, roughly together.
US Treasury yields have been climbing too
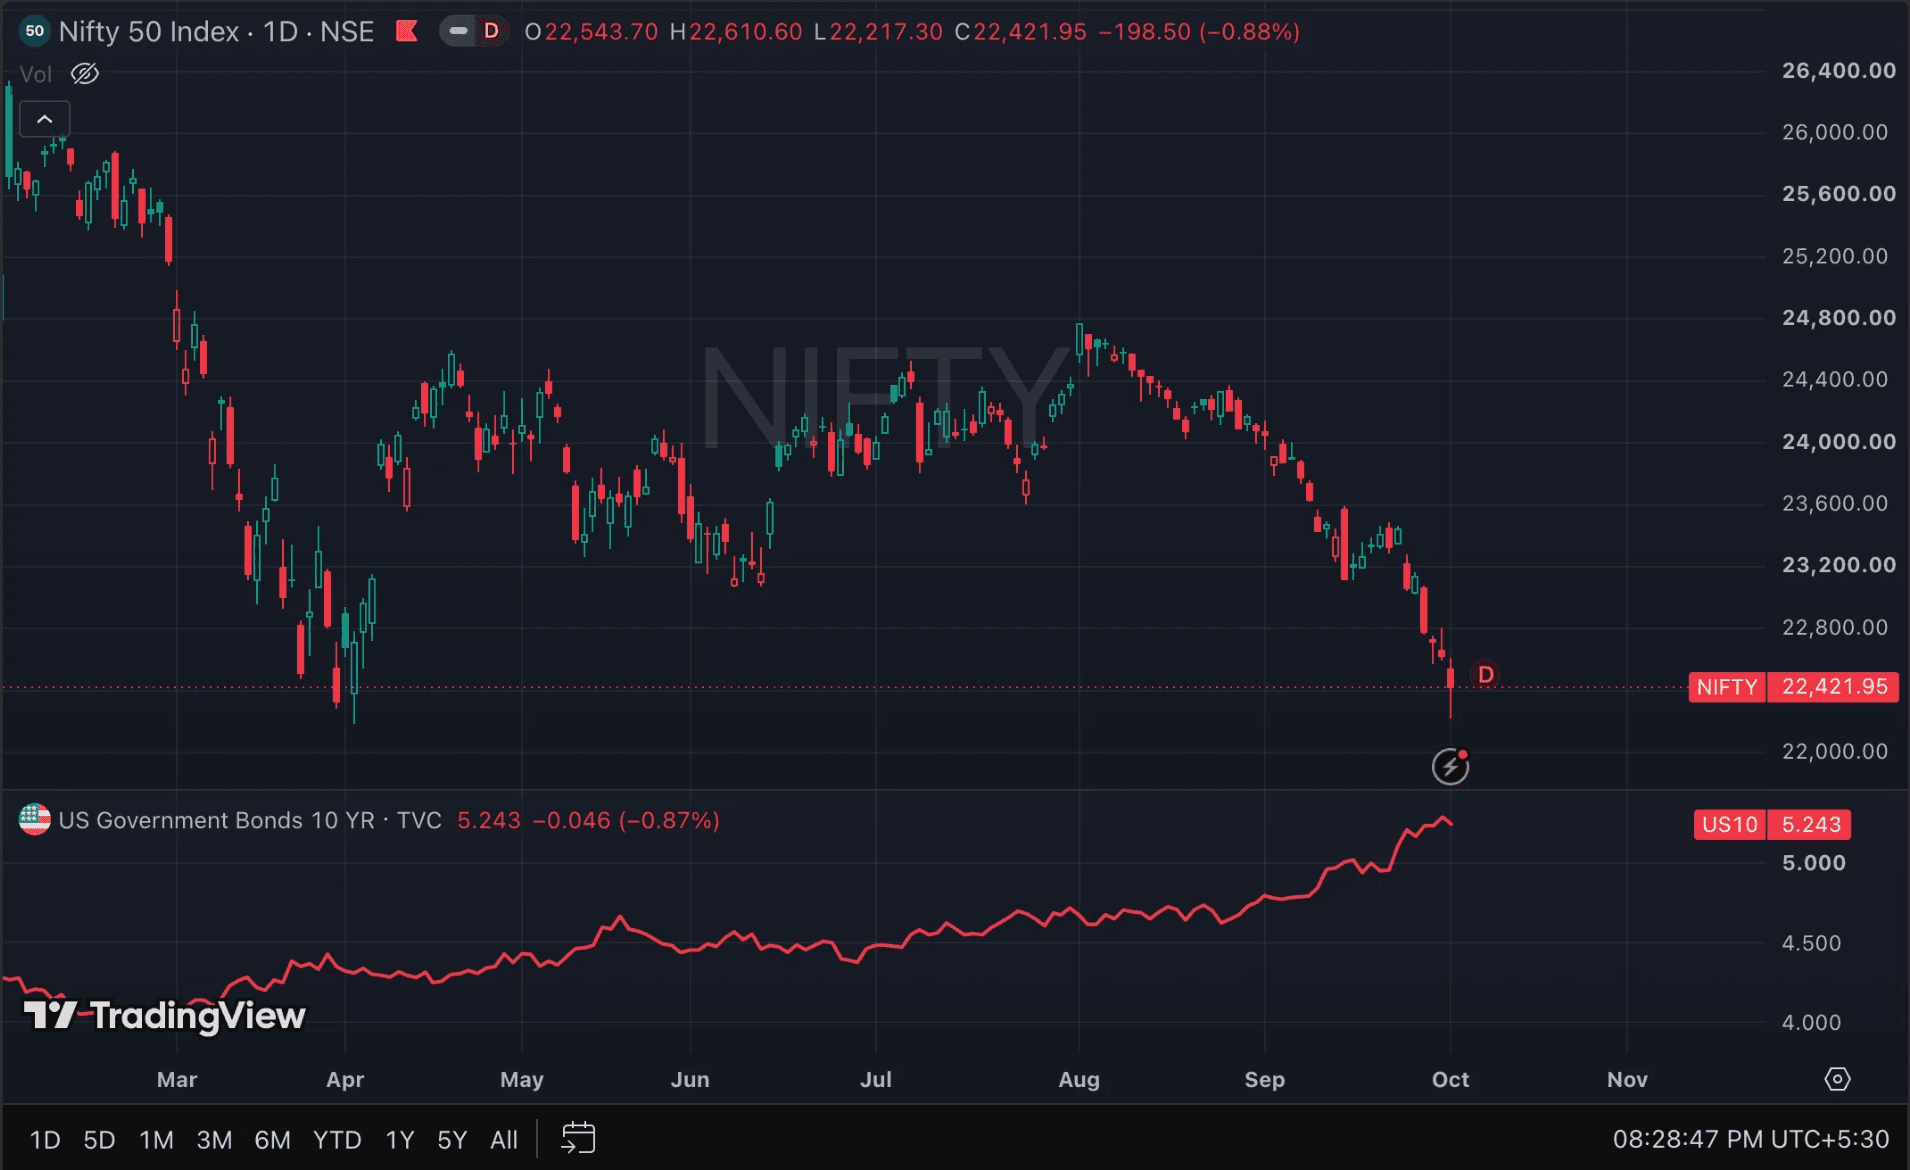
The US 10-year Treasury yield has pushed above 5.2%, up from around 4% earlier this year — and like the dollar and crude, its steepest recent climb lines up with Nifty's sharpest leg down. This is a third macro number moving against Indian equities at the same time as the other two.
Nifty 50 (candles) vs. US 10-Year Treasury yield (bottom panel). Chart: TradingView.
Why rising yields matter beyond the US
A higher risk-free yield on US government bonds makes dollar-denominated fixed income more attractive relative to emerging-market equities, which adds to the same FII-flow pressure the dollar's strength is already creating. It also raises the discount rate investors apply to future company earnings everywhere, not just in the US — and a higher discount rate lowers what those future earnings are worth today, which weighs on equity valuations broadly, India included.
Three pressures that compound each other
On their own, a stronger dollar, pricier crude, and higher US yields are each a headwind. Together, they compound: costlier oil widens the trade deficit, which adds to rupee pressure on top of whatever pressure the stronger dollar is already putting on the currency directly, while higher US yields pull at the same FII flows from a different direction. A weaker rupee then makes the same barrel of oil cost even more in rupee terms — part of why oil-importing economies like India tend to feel this kind of combination more than oil exporters do.
None of this is a forecast of where Nifty, the rupee, or oil go from here — that depends on things no single data point can answer, including how long the dollar's current strength and elevated US yields hold, and what OPEC+ and global demand do next. What's useful is understanding the mechanism, since "the market fell" is a far less useful sentence than knowing which two or three things were actually pulling on it.
Why isn't gold rising in this panic?
If equities are under pressure, the instinct is to expect gold to be having a good week — it's the textbook safe-haven trade. This time, gold hasn't moved the way that instinct would suggest, and the bond yield move above is the biggest reason why.
Gold pays no interest or dividend — holding it only ever costs you the return you gave up by not holding something else. When the risk-free US 10-year yield is above 5%, that opportunity cost is unusually high, and gold's historical relationship with real yields is one of the most well-established in markets: as yields climb, gold typically becomes less attractive to hold, almost regardless of what else is happening. That's working against gold at exactly the moment equity weakness would normally be working for it.
The dollar adds a second layer on top of that. Gold is priced in dollars globally, and it has historically shown a strong inverse relationship with the Dollar Index too — a stronger dollar makes gold costlier for buyers holding any other currency, which further caps demand.
There's a third piece: not every equity sell-off is the same kind of "panic." Classic flight-to-safety moves — a geopolitical shock, a banking-system scare — tend to send money into gold specifically because the trigger is fear itself. A sell-off driven more by rising yields, a strengthening dollar, and higher input costs is a different kind of pressure, and it doesn't automatically produce the same safe-haven reflex, because two of the forces driving the sell-off are themselves working directly against gold.
None of this is a signal to do anything with your portfolio — understanding why markets are moving is a different exercise from deciding what to do about it, and the second one depends entirely on your own goals, timeline, and what you're already holding. If you want to talk through how a stretch like this fits into your specific portfolio, that's a conversation worth having.
B.E. in Civil Engineering · M.B.A. in Finance · NISM-certified Research Analyst · NISM-certified Equity Derivatives
With a passion for financial markets spanning more than a decade, Aditya's work is centred around understanding businesses, markets, and the sectors in which they operate. He believes that meaningful wealth creation is built over the long term through disciplined investing, continuous learning, and informed decision-making. His primary focus is equity and sector-specific research — he continuously studies companies, industries, and market trends, with this research forming an important part of the stock and mutual fund selection process at Vision Investment.
“Good investing begins with good research — and good research never stops.”
Co-Founder
Dip Modi
Co-Founder | Mutual Funds, Insurance & Taxation
B.Com. in Taxation · LL.B. · NISM-certified Equity Derivatives · AMFI-certified Mutual Fund Distributor
With more than a decade of interest and experience in financial markets, Dip brings a complementary perspective to Vision Investment, combining investment knowledge with a strong understanding of taxation, mutual funds, and insurance. He has been involved in GST-related matters since the introduction of GST in India, developing practical experience in the evolving tax and compliance environment. His primary areas of focus are mutual fund investments, insurance solutions, and taxation-related matters — helping clients understand the financial and tax implications of their decisions.
“The right financial decision is not only about returns — it is about understanding the complete picture.”
It's never too early to plan ahead.
Mutual funds, SIP, Life insurance, health insurance, vehicle insurance — whatever your goal is, just tell us. We'll sit down with you at our office, or if that's easier, we can sort it out over a quick phone call too.